The Cardio Wave Analyzer
The Detailed Reports
Add A General Health Component to Your Practice!
The Three Minute Test that Tells Your Patients
1. ARE THEIR ARTERIES HEALTHY?
2. ARE THEIR STRESS LEVELS OK?
Only Very Healthy Patients Pass This Test.
Most Patients Need Your Help!
Benefits of the Cardio Wave Analyzer
- Early detection of arterial wall elasticity and determination of biological arterial age in less than 3 minutes.
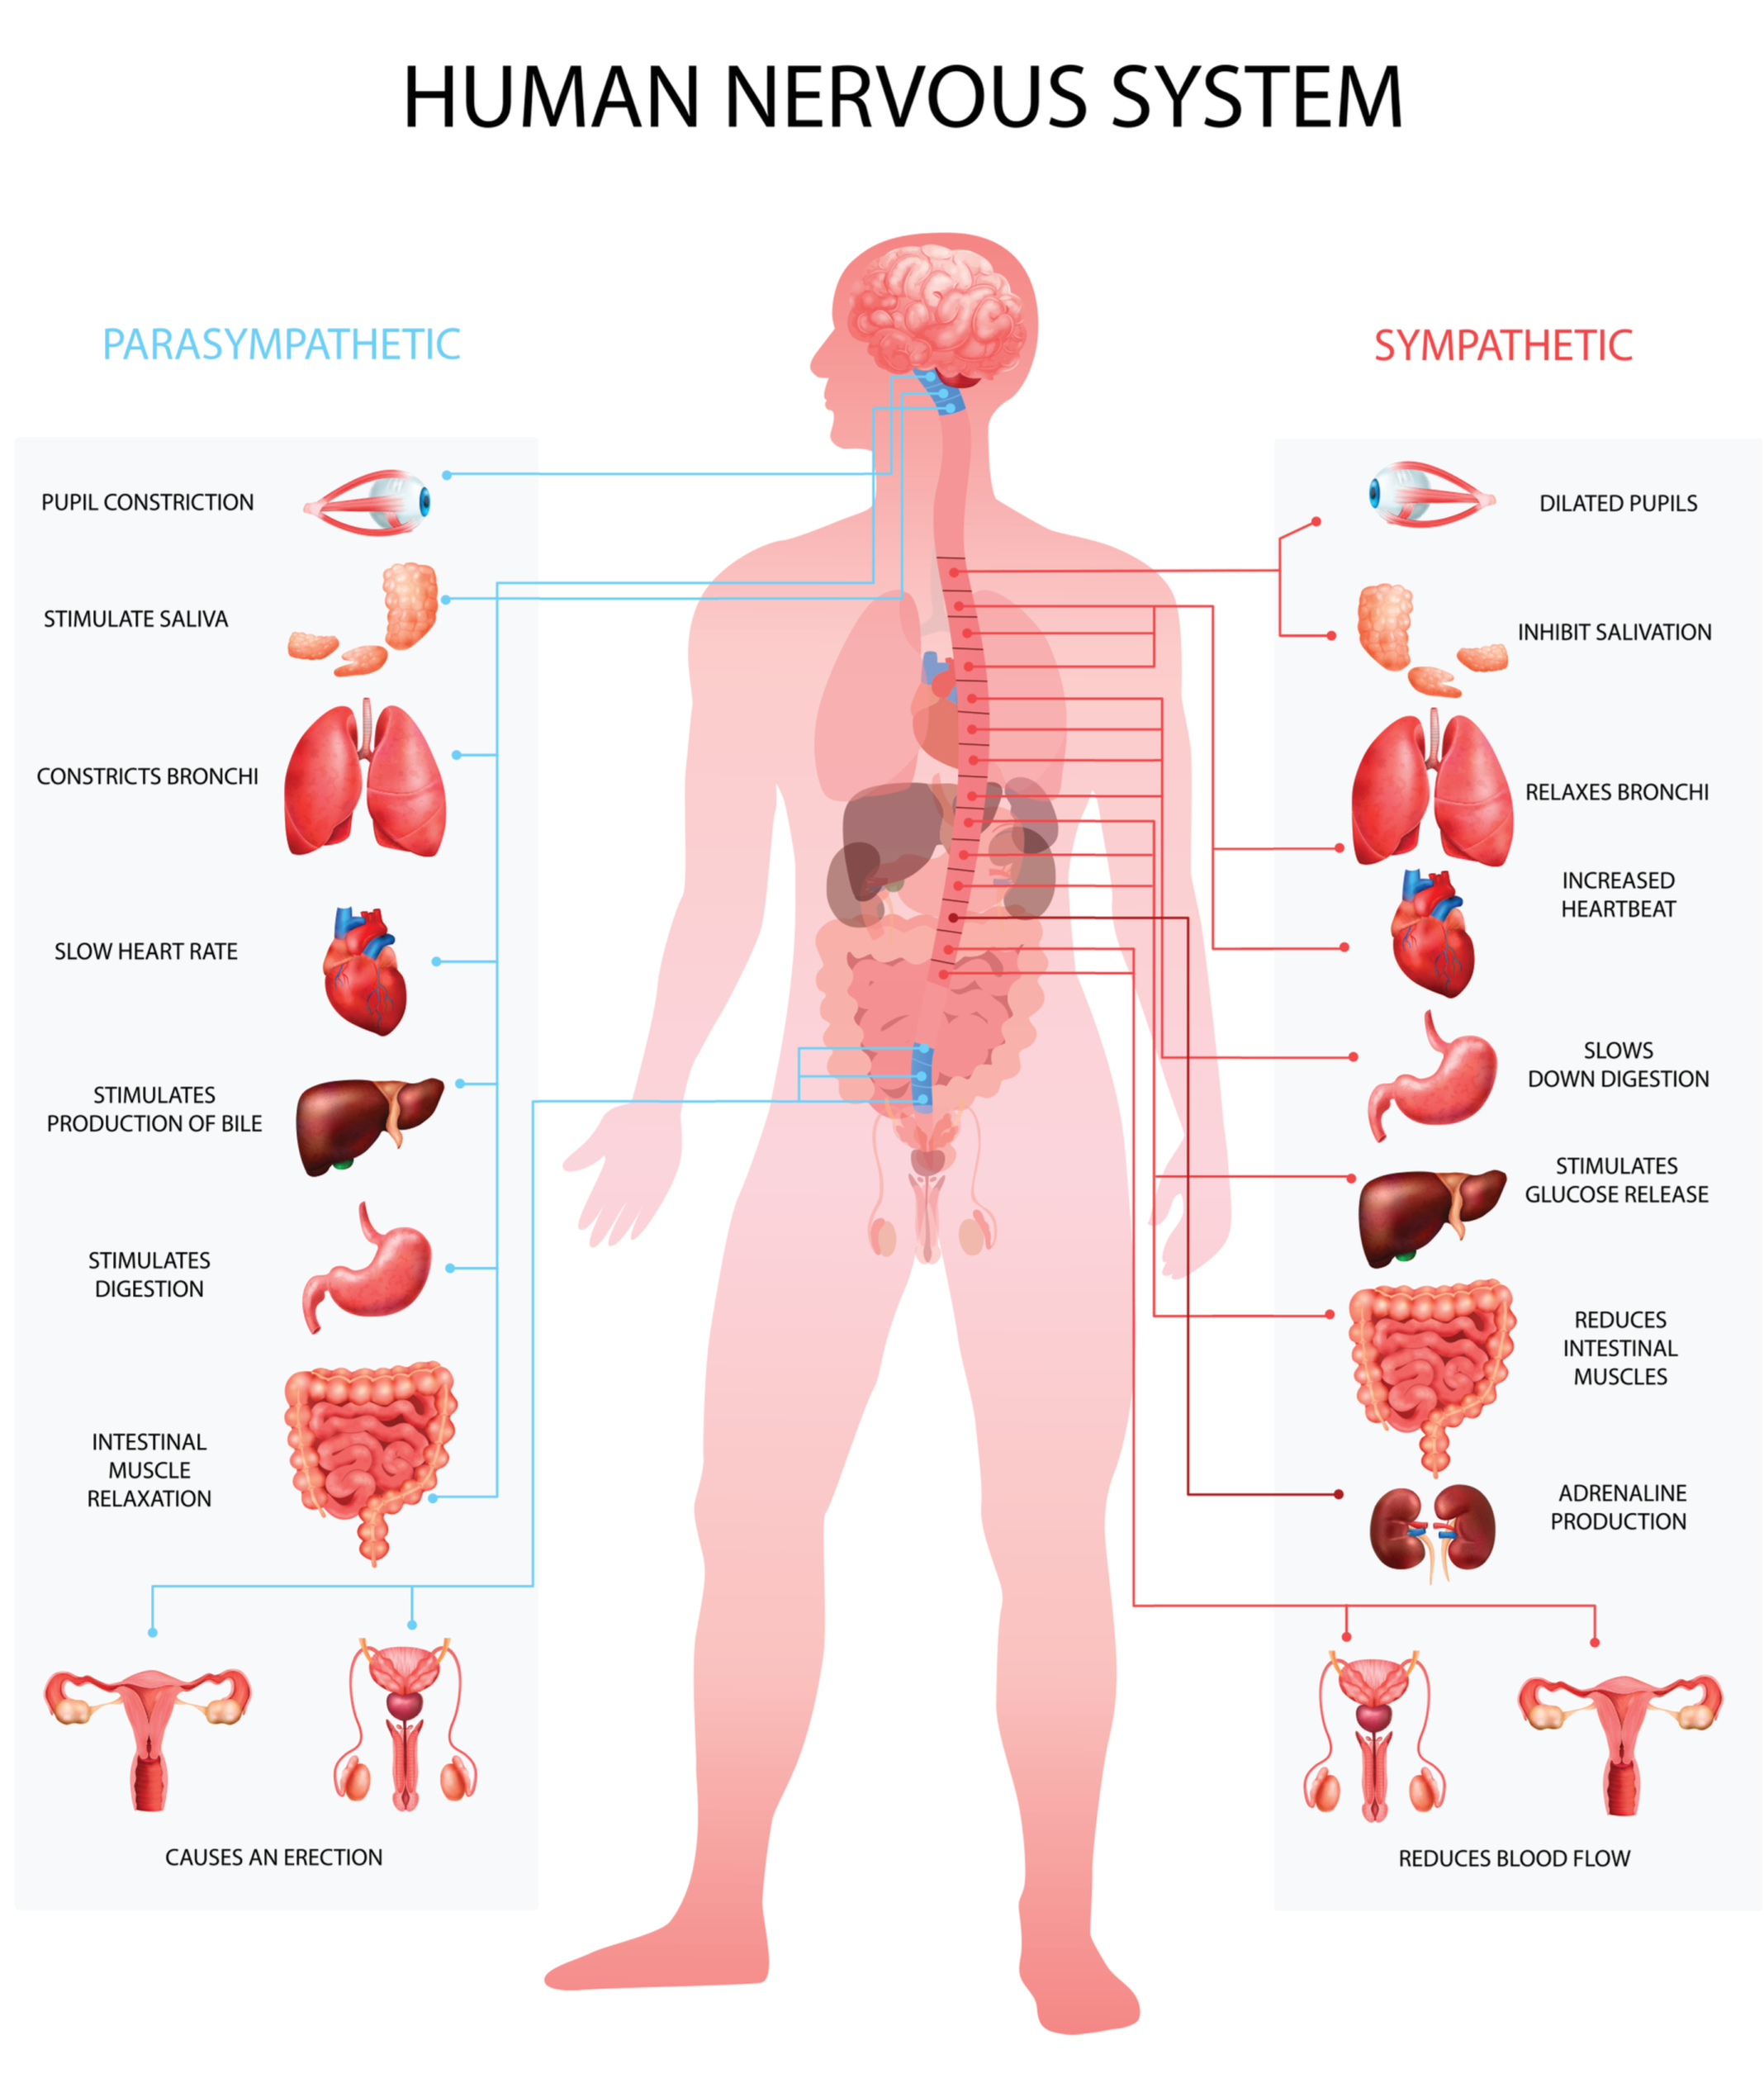
- Tests Heart Rate Variability (HRV) for full analysis of stress related Autonomic Nervous System issues.
- Monitors effectiveness of therapeutic intervention and response to lifestyles changes / reduction of cardiovascular risk factors
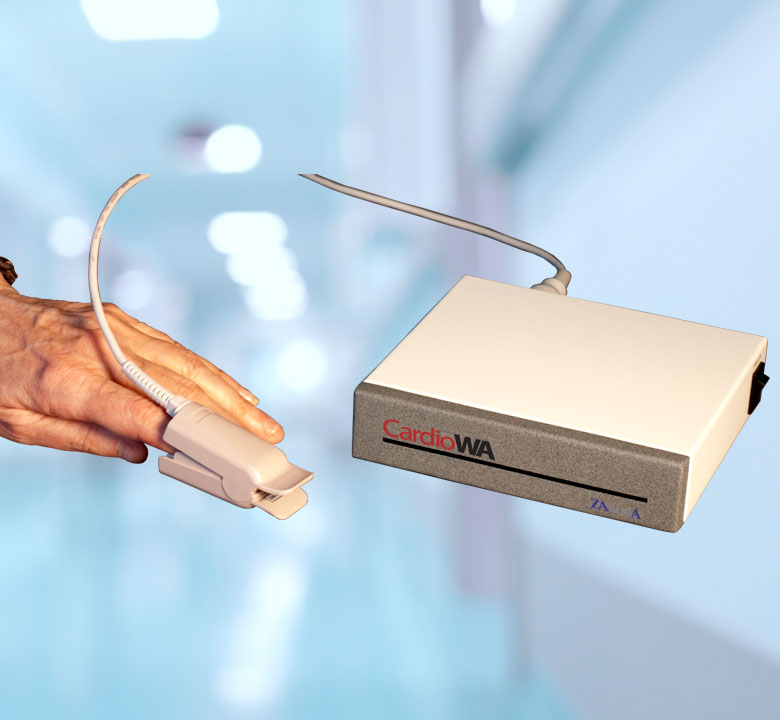
- Non-invasive – uses a LED/Photodiode finger probe sensor.
- Device is FDA approved.
- Cardio WA is lightweight and portable.
- User friendly, anyone can learn to use it.
- Color report printouts.
- Revenue generator.
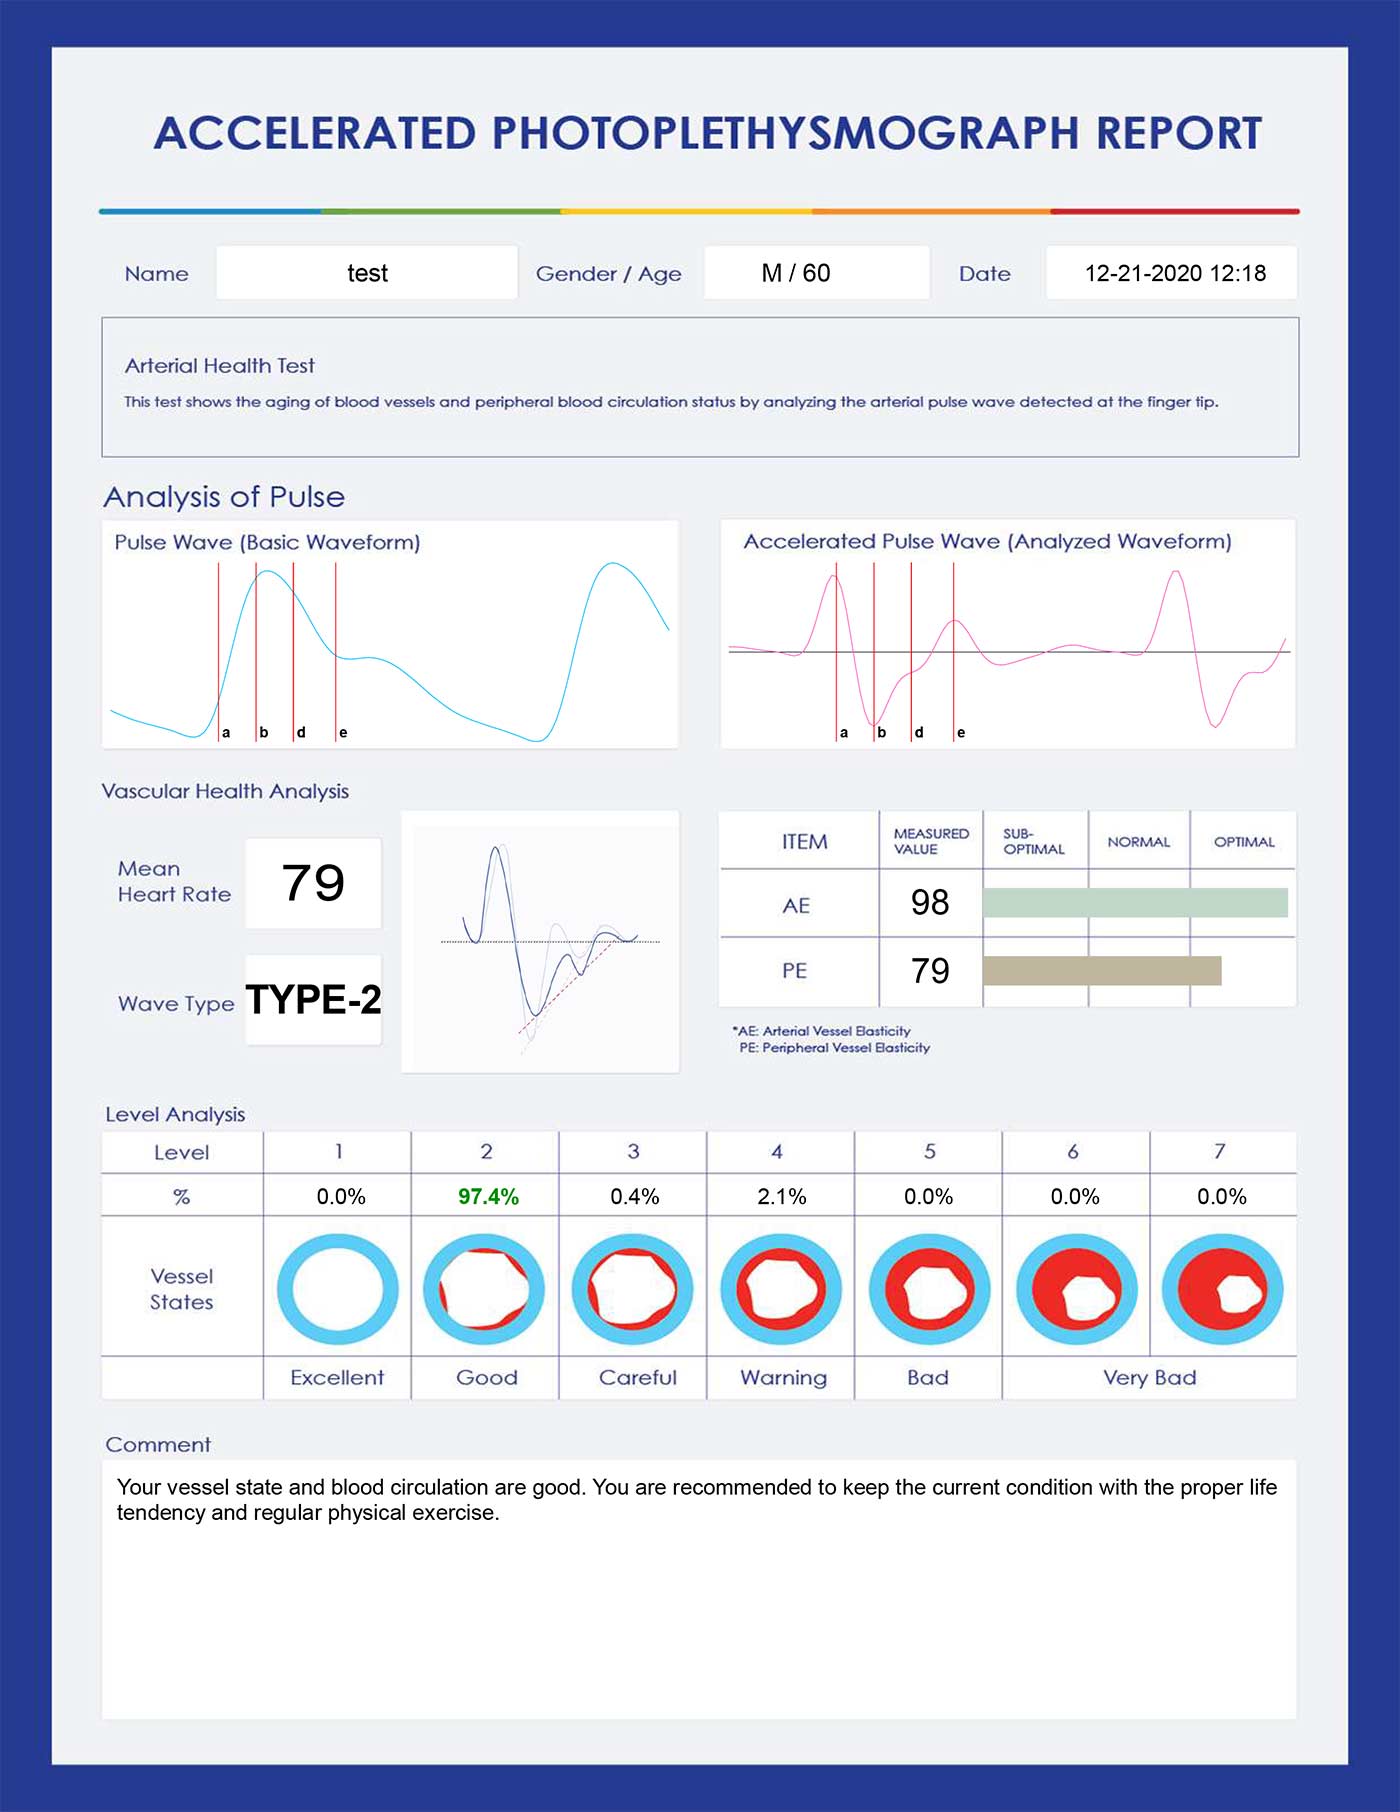
Report Covering Arterial Health
Pulse Wave Waveform: Allows the practitioner to note if there is a dichrotic notch visible or not. The presence of a visible dichrotic notch as in this example is a sign of arterial flexibility.
Mean Heart Rate(HR): How many beats per minute for one’s heart. The mean or average beats per minute is normally in the 60-90 range for adults.
Wave Type: Describes the patients wave form and shows the percentage of heartbeats that fell into each waveform. Type 1 is perfect arterial health and the levels progress downwards as the arteries harden and the heart weakens until reaching the lowest level of health at Type 7.
AE (Eccentric Constriction): Represents the contraction power of vessels from the left ventricle.
PE (Peripheral Elasticity): Represents the blood circulation that is analyzed as well as the vascular elasticity and the resistance of the small vessels.
Level Analysis: Shows the dominant wave type. This is calculated as the Wave Type with the most number of heartbeats. For fuller understanding look at the percentages in the Aging Vascular Health Above.
Percentage Breakdowns of the Levels: The percentages at the bottom of the report are vitally import as that is where you first see changes. Long before a patient jumps from one level to the next, the percentages will start to shift in the direction of the next level. In this way small changes can be seen as they are happening. Full training video available.
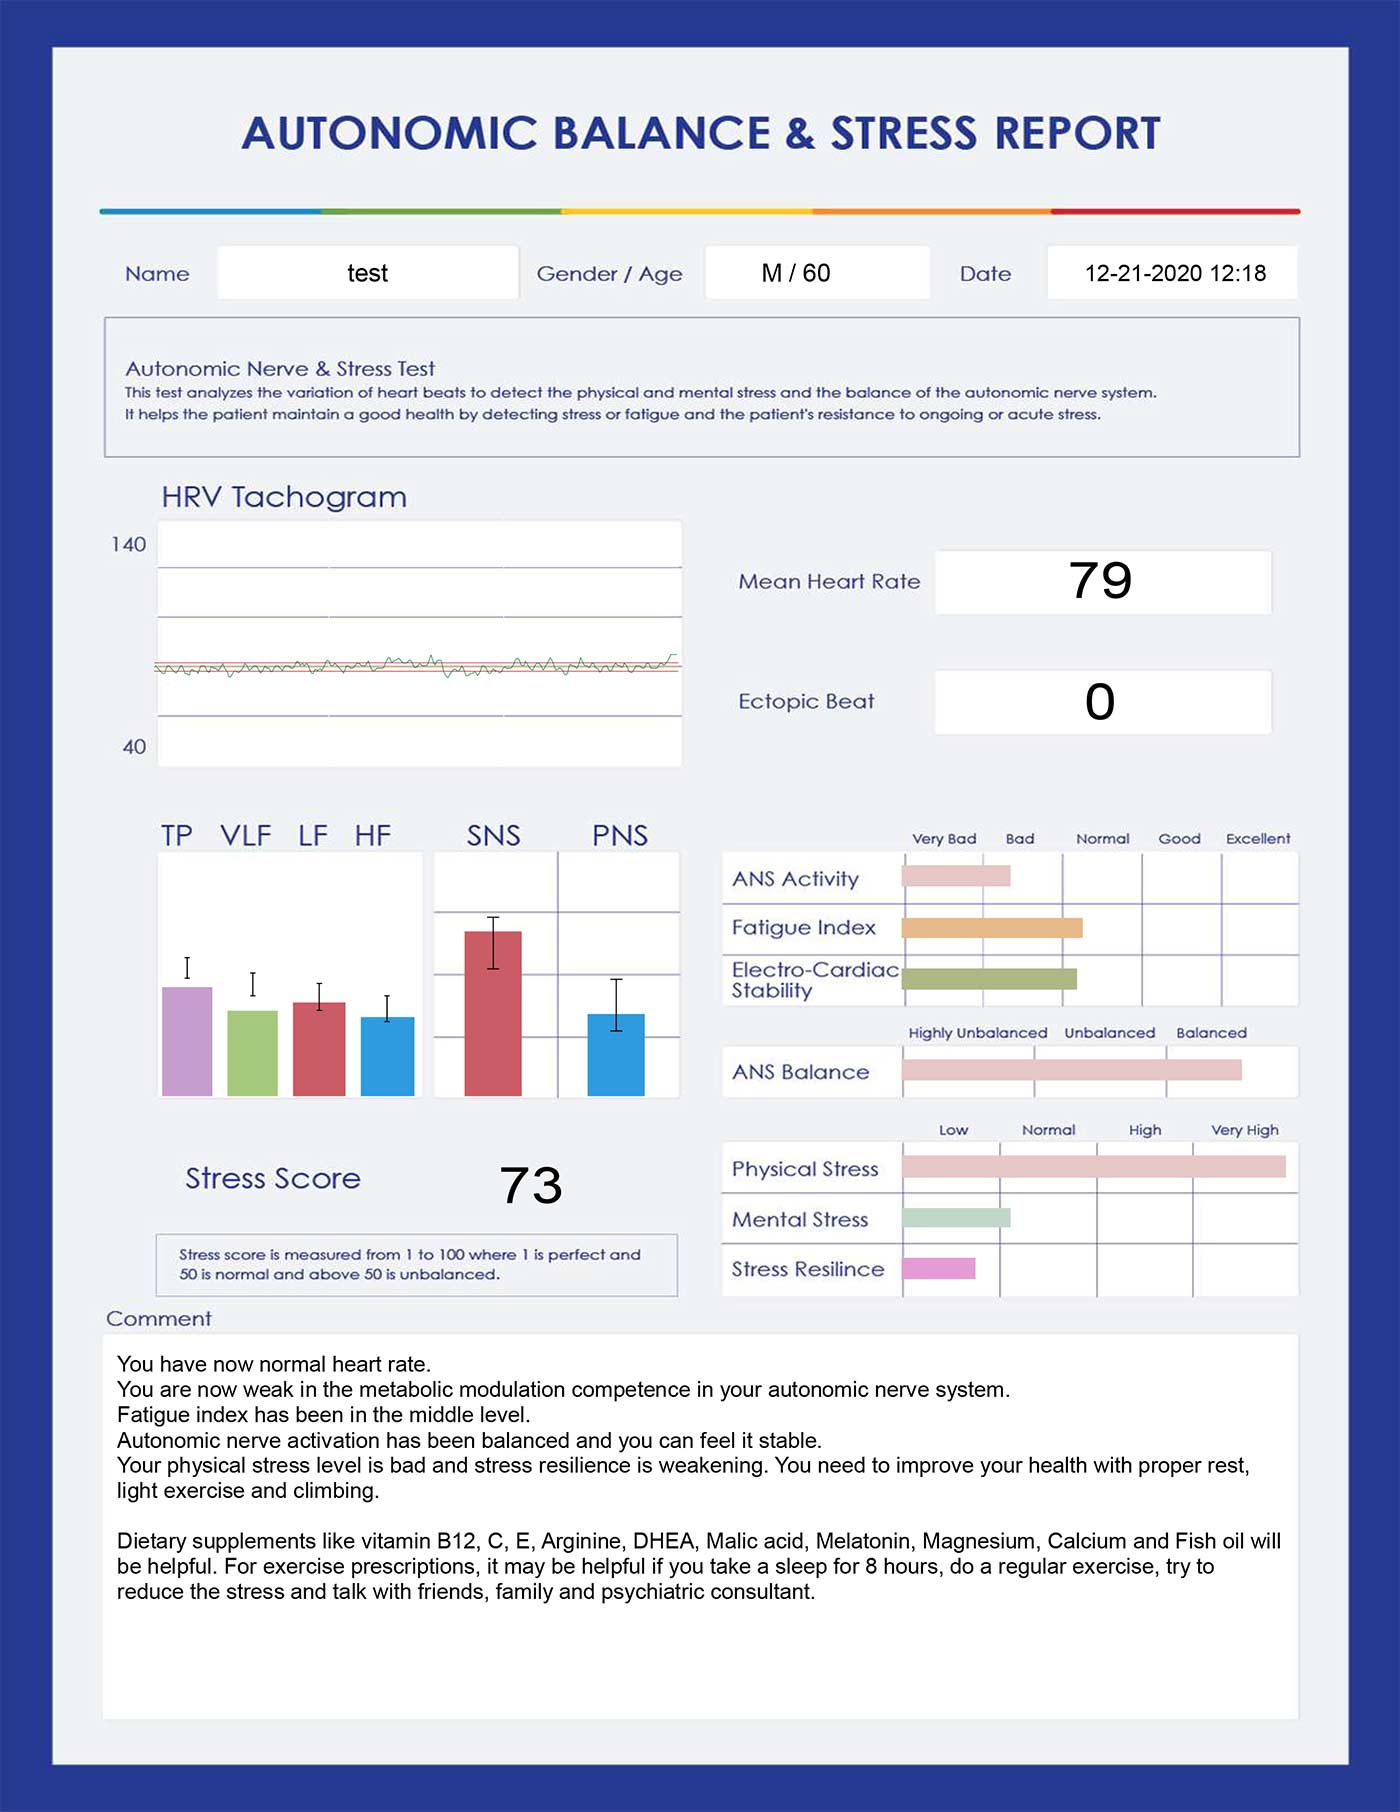
Report Covering ANS Balance
The HRV Tachogram: Presents the fluctuation of the heart rate during the 3 minute test. The variation in heart beats is influenced by constant AUTONOMIC NERVOUS SYSTEM regulation of the heart. A more erratic reading indicates more Heart Rate Variability and a healthier heart versus a reading that is monotonous or evenly level. (Very stressed people have less variability in their heartbeat).
TP VLF LF HF Bar Graphs: Total Power / Very Low Frequency/Low Frequency/High Frequency. Shows the analysis of your heartbeats, dividing them into categories for evaluation.
SNS/PNS Bar Graphs: SNS (sympathetic nervous system) & PNS (parasympathetic) Balance. SNS and PNS ratio is normally at around 6:4 ratio between SNS and PNS. Higher SNS: nervous, anxiety, agitation, excitement, in-creasing blood pressure, headache, etc. A lower SNS and a high PNS can indicate acute fatigue or chronic fatigue which can indicate an underlying condition.
The Power Spectral Density: (Not normally used for interpretation – other bar graphs are drawn from this information) Shows levels of Sympathetic and Parasympathetic activity and their balance. Power in the 4 frequency bands analyzed.
Physical Stress: An estimation of how much physical stress the patient is experiencing.
Mental Stress: An estimation of how much mental stress the patient is experiencing.
Stress Resistance: How well your body is dealing with the stress that it is under. More physically healthy and robust individuals can handle higher levels of stress imbalance. Poor stress resistance shows the patient is not healthy enough to withstand their stress levels and should take action to reduce stress and improve overall health and fitness.
Stress Score: Gives patient Overall Stress Score that takes into account stress levels and stress resistance. Low stress and high stress resistance gives the best score (lowest number). Allows the the practitioner to determine if actions is needed to bring stress levels down into normal or optimal ranges. Score if from 1 -100 where 1 is perfectly balanced with good resistance to any stressors and 100 is the most unbalanced and the lowest score. (More Information is given in the training materials, including training video.)
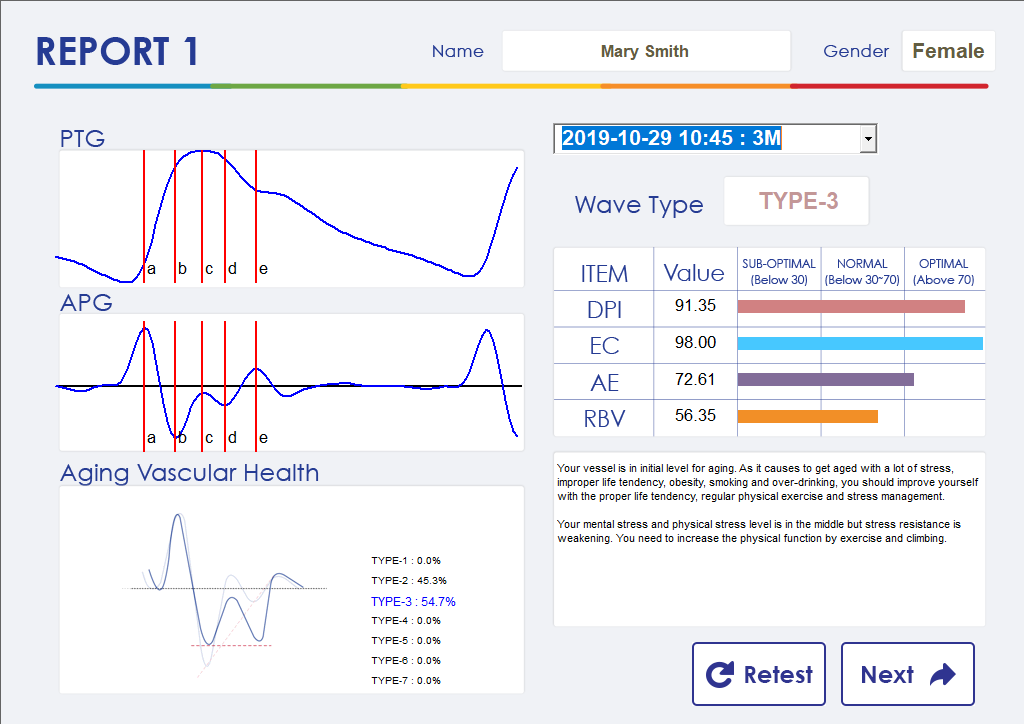
Screen Shots of what you will see on the computer after running the Test. Waveforms Produced By the Cardio WA
When you run the test on someone, this will take 3 minutes. Once it has completed, this is what you will see on the screen. Before printing the report you can review the patient information on the initial screens. These screens present the Arterial information first, followed by the next screen where you will see the Stress Score information.
You will be able to see immediately what the person’s scores are for Arterial Health and Stres Analysis.
Plethysmogram (PTG) Waveform
The shape of the pulse wave is determined, in part, by the elasticity of the blood vessels. The Cardio WA can analyze the shape of the curve to get early information about a developing arterial vascular disease. The pulse wave analysis can often detect changes very early, and is non-invasive, very easy to use, and one of the most economical techniques available today. The Cardio WA use a fingertip probe sensor – light from the LED/Photodiode is transmitted through the tissue at the sensor site. The Photodiode detects the changes in the amount of light absorbed by the hemoglobin which forms the PTG.
Accelerated Plethysmogram (APG) Waveform – The second derivative of PTG – an excellent method to evaluate the biological age of arteries.
Cardio WA and Heart Rate Variability
Heart Rate Variability, when decreased implies less ability to respond to changes in the environment. Too much consistency in heart rate (less variability) is often associated with dysfunction and disease. The Cardio WA analyzes imperceptible changes in the heart rate waveforms, provides indices and evaluates the current body condition of the autonomic nervous system.
Low HRV has been shown in numerous studies to be related to a higher mortality rate in both healthy and unhealthy subjects. It thus can be shown to be a strong predicator of all-cause mortality. The heart is a complex sensory organ with its own functional “heart brain” that communicates with and influences the brain via the nervous system, hormonal system and other pathways.
Research has shown that these influences profoundly affect brain function and most of the body’s major organs. Science now confirms that stress significantly increases the risk of heart disease, including sudden cardiac death. Unmanaged emotional stress is equally if not more important than physical variables in determining health outcomes. A conservative estimate is that 75% of visits to primary care physicians are due to stress-related disorders.
Cardiovascular-related issues are not the only uses for the Cardio WA. Psychologists are increasingly recognizing the importance of HRV. A number of studies have demonstrated that patients with anxiety, phobias and post-traumatic stress disorder (PSTD) consistently show lower HRV, even when not exposed to a trauma related prompt. Importantly, this relationship existed independent of age, gender, trait anxiety, cardio-respiratory fitness, heart rate, blood pressure and respiration rate.
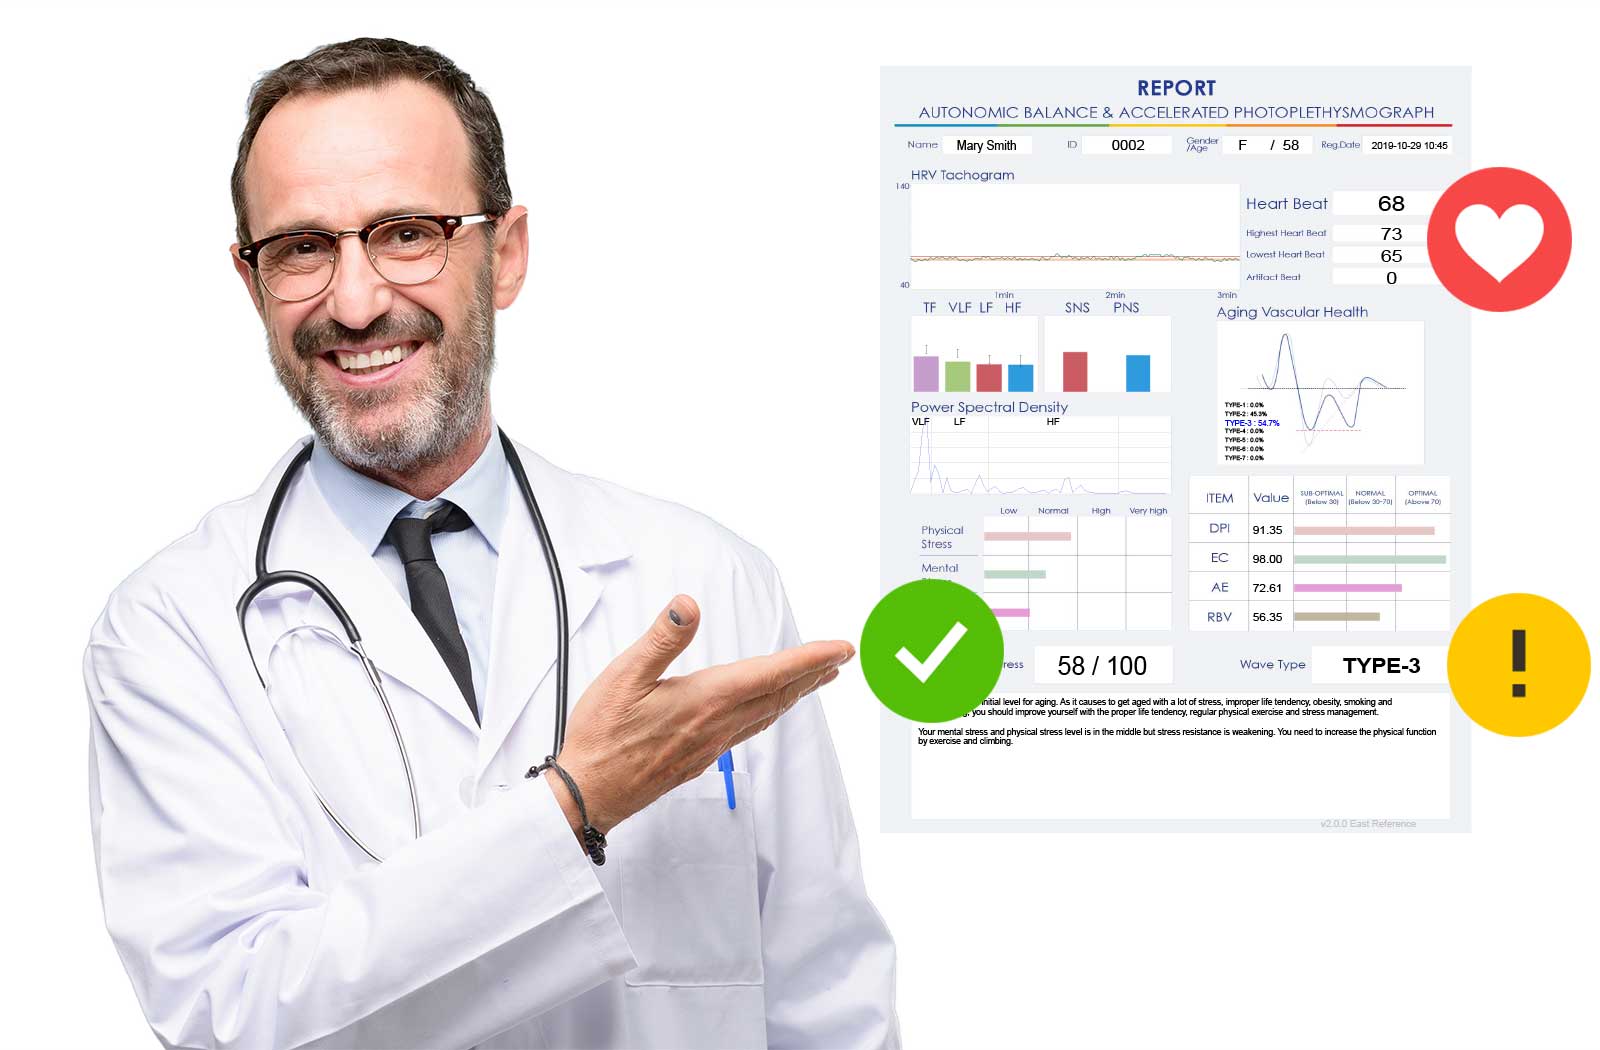
The Report in a Nutshell
The HRV Tachogram: Presents the fluctuation of the heart rate during the 3 minute test. A more erratic reading indicates more Heart Rate Variability and a healthier heart versus a reading that is more level. (Stressed people have less variability in their heartbeat).
Heart Beat: How many beats per minute for one’s heart. The mean or average beats per minute is normally in the 60-90 range for adults. Artifact Beat represents the number of irregular or unrecognizable heartbeats. If more than 5, the test should be retake. If the irregular beats remain, patient might have an arrhythmia.
TP, VLF, LF, HF Bar Graphs: Total Power / Very Low Frequency/Low Frequency/High Frequency. Shows the analysis of your heartbeats, dividing them into categories for evaluation.
Aging Vascular Health: Describes the patients wave form and shows the percentage of heartbeats that fell into each waveform. Type 1 is excellent arterial health and the levels progress downwards as the arteries harden and the heart weakens until reaching the lowest level of health at Type 7.
Power Spectral Density: Shows levels of Sympathetic and Parasympathetic activity and their balance. Power in the 4 frequency bands analyzed.
Stress Measurements: Shows how much physical or mental stress the patient is experiencing. Stress Resistance shows How well the body is dealing with the stress that it is under. More physically healthy and robust individuals can handle higher levels of stress imbalance. Poor stress resistance shows the patient is not healthy enough to withstand their stress levels and should take action to reduce stress and improve overall health and fitness.
Score of Your Stress: Gives patient Overall Stress Score that takes into account stress levels and stress resistance. Low stress and high stress resistance gives the best score (lowest number). Allows the the practitioner to determine if actions is needed to bring stress levels down
WaveType: Shows the dominant wave type and is the person’s score for arterial elasticity. 1 is the best score and 7 is the most serious. This is calculated as the Wave Type with the most number of heartbeats. For fuller understanding look at the percentages in the Aging Vascular Health Above.
Hear it from Others…
“As a Naturopath and Nutritional Consultant, I wanted an inexpensive professional tool that would help me to help and educate my patients about their cardiovascular health, as well as make them aware of their stress levels. The CardioWA is such a great machine! In a few minutes I get so much data with a great report. This helps me graphically show my patients where their current cardiovascular and stress levels are at. Also, THANK YOU for making the experience of buying the Cardio Wave Analyzer a most pleasant one.” –CJ, ND, CNC Oklahoma
“This system is one of the best medical tools I have ever used and provides one of the most comprehensive cardiovascular screenings available. My work as a health practitioner over the past 20 years or so, with a particular focus on cardio issues, has been wonderfully enhanced through the use of this particular system. It has been invaluable in assisting those I work with to lead healthier lives and I am certain it has saved some too.” – D.N. Health Coach
Rent, Lease or Own your Cardio Wave Analyzer!
Rent
Low Monthly Payments- Easy monthly payments, with initial 3 month trial period.
- Finger probe, Software to load on any laptop or computer and all accessories included.
- Laptop not included. Tax and shipping not included.
Lease
36 Monthly Payments- 3 year lease to own. $225 per month for 36 months.
- Finger probe, Software to load on any laptop or computer, and all accessories included.
- Laptop not included. Tax and shipping not included.
Purchase
Own the CardioWA- Finger probe and all accessories included.
- Software to load on any laptop or computer included.
- Laptop not included.
- Tax and shipping not included.
Warranty: The CardioWA machines carry a full 5 year warranty. The warranties for machines imported by us are supported by trained technicians in our Texas repair facility.
Extended Warranty: Please enquire about extended warranty options.

